# Summary statistics
summary(mtcars$mpg)
Min. 1st Qu. Median Mean 3rd Qu. Max.
10.40 15.43 19.20 20.09 22.80 33.90 # Create a simple plot
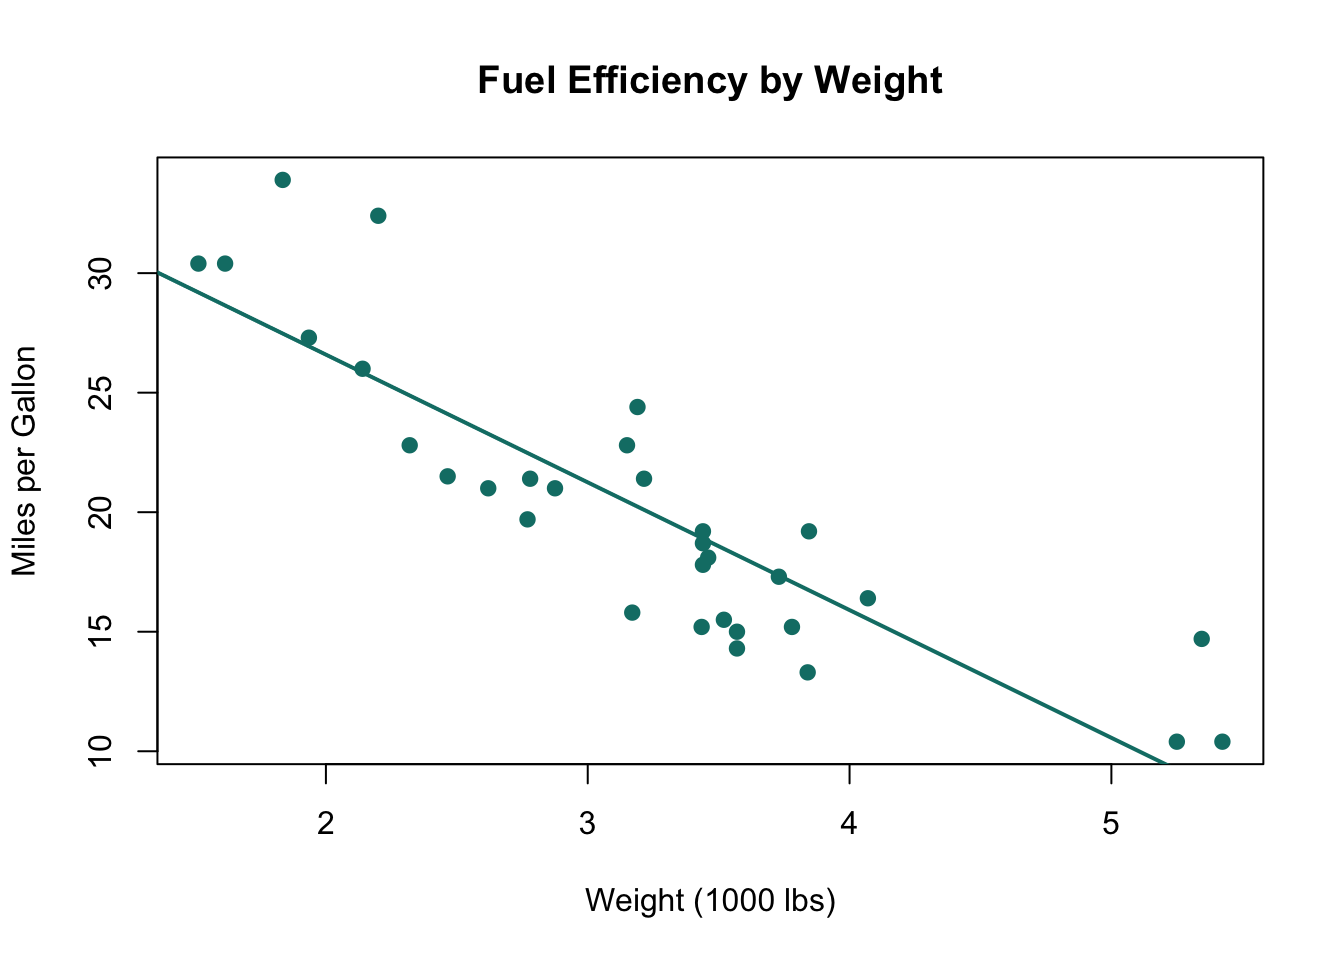
plot(mtcars$wt, mtcars$mpg,
main = "Fuel Efficiency by Weight",
xlab = "Weight (1000 lbs)",
ylab = "Miles per Gallon",
pch = 19,
col = "#0d7d75")
# Add a trend line
abline(lm(mpg ~ wt, data = mtcars), col = "#0d7d75", lwd = 2)